Air Quality Intelligence Platform
Air Quality Intelligence Platform
Data Visualization
Data Visualization
Enterprise B2B
Enterprise B2B
System Design
System Design
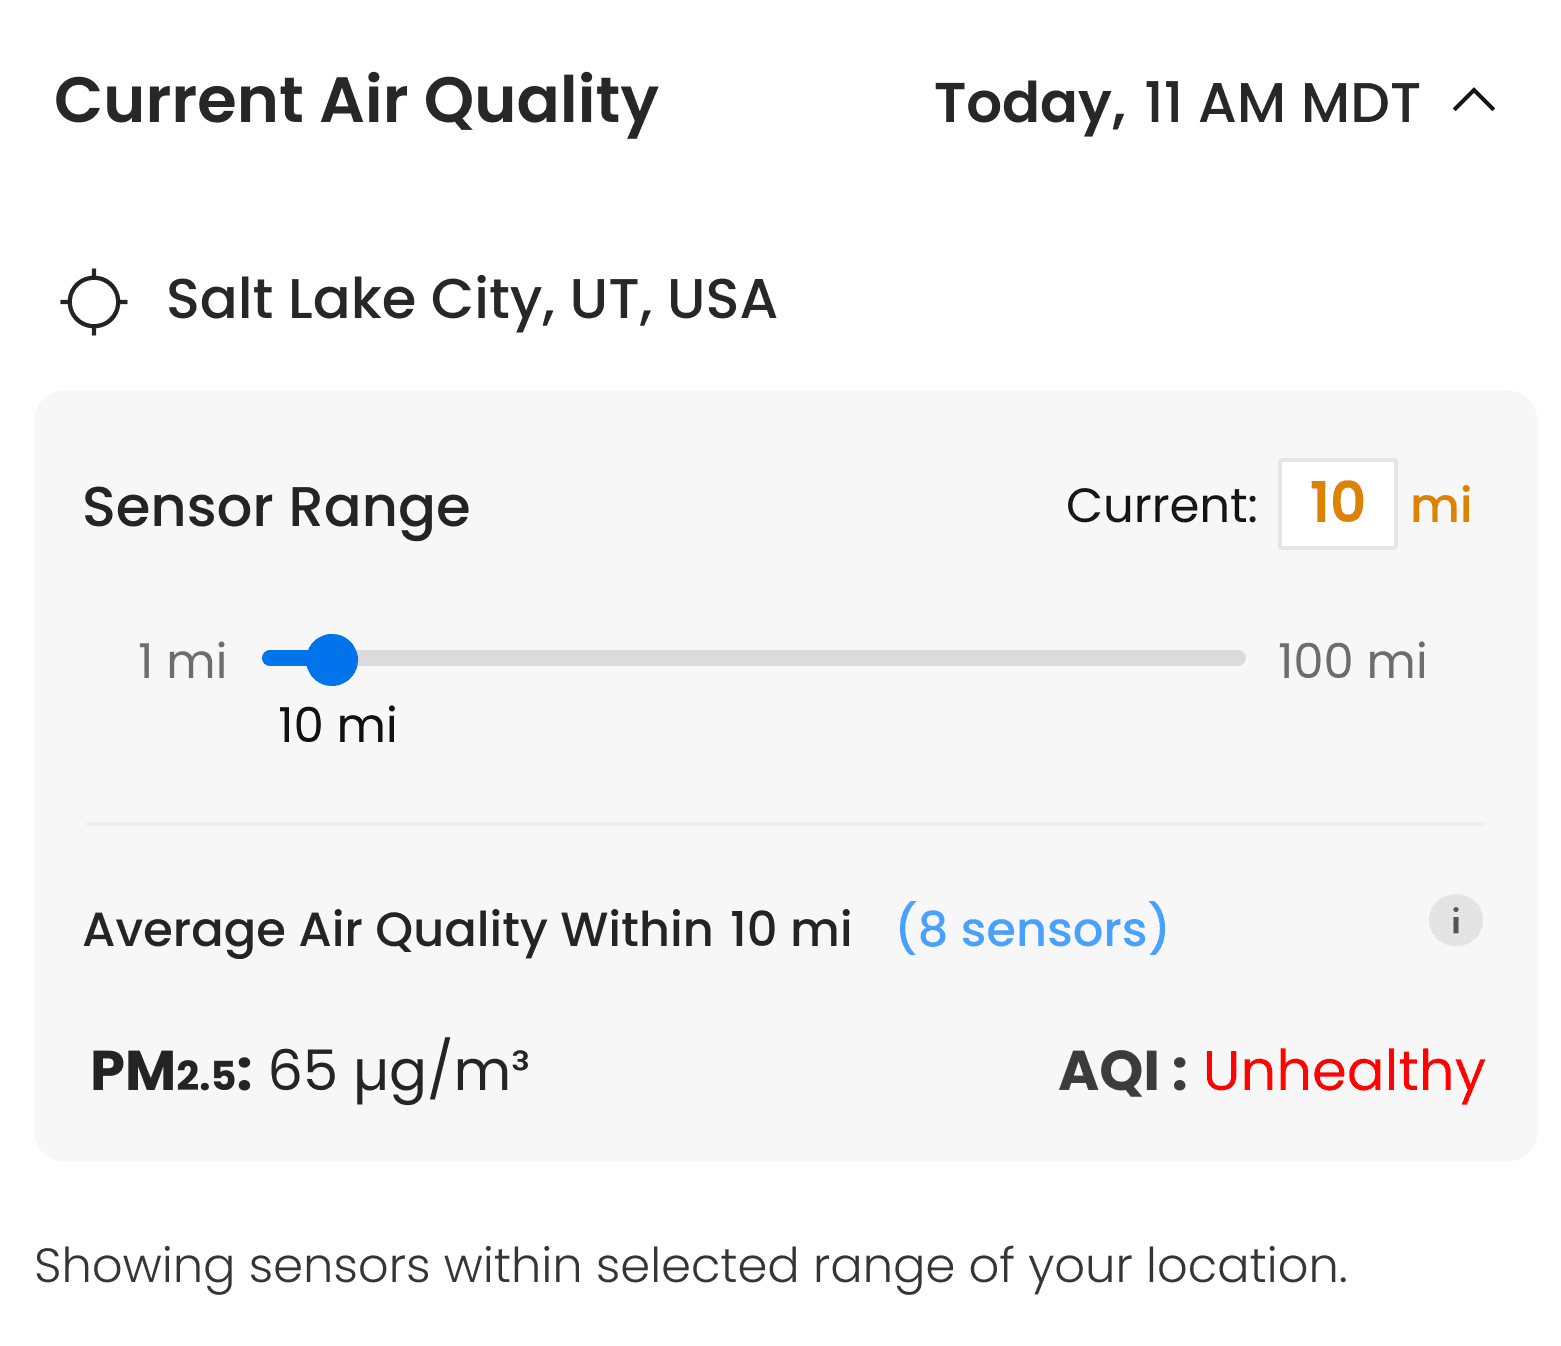
Aero is an enterprise air quality forecasting platform. I led design end to end , from initial research and architecture through visual design and production, working directly with the founder on product strategy.
The challenge: make a technically complex atmospheric data platform legible and usable for five completely different enterprise audiences.